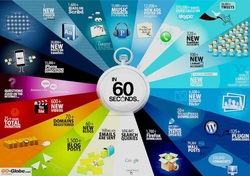
The need to be visually literate in the 21st century is continuing to grow. “In an uncharted world of boundless data, information designers are our new navigators,” begins a recent Times article, “When the Data Struts Its Stuff.” To bring home just how important it is to be able to navigate through a sea of data, check out how much content is created in just sixty seconds online.
Information graphics or infographics are visual representations of information, data or knowledge. These graphics are used where complex information needs to be explained quickly and clearly, such as in signs, maps, journalism, technical writing, and education. They are also used extensively as tools by computer scientists, mathematicians, and statisticians to ease the process of developing and communicating conceptual information. Our student process half the information around them through images. Therefore infographics can be a powerful classroom tool.
Information graphics or infographics are visual representations of information, data or knowledge. These graphics are used where complex information needs to be explained quickly and clearly, such as in signs, maps, journalism, technical writing, and education. They are also used extensively as tools by computer scientists, mathematicians, and statisticians to ease the process of developing and communicating conceptual information. Our student process half the information around them through images. Therefore infographics can be a powerful classroom tool.

There are many ways to use Infographics in the classroom.
Infographics can be a source of information- Infographics are abundant online and in newspapers, magazines and books. It allow students a new medium to be introduced to complex data, gain understanding, draw conclusions and see relationships.
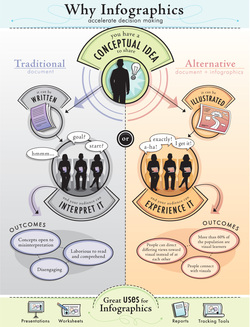
Infographics can be a powerful tool to teach visual and critical literacy. These are key 21st century skills. Infographics are traditionally viewed as visual elements such as signs, charts, maps, or diagrams that aid comprehension of a given text-based content. Often more powerful than words or imagery alone, infographics utilize visual elements of design and words to convey a message in such a way that context, meaning and understanding are transcended to the observer in a manner not previously experienced.
Infographics can be a way for students to express their or others’ data.
Infographics can be a source of information- Infographics are abundant online and in newspapers, magazines and books. It allow students a new medium to be introduced to complex data, gain understanding, draw conclusions and see relationships.
Infographics can be a powerful tool to teach visual and critical literacy. These are key 21st century skills. Infographics are traditionally viewed as visual elements such as signs, charts, maps, or diagrams that aid comprehension of a given text-based content. Often more powerful than words or imagery alone, infographics utilize visual elements of design and words to convey a message in such a way that context, meaning and understanding are transcended to the observer in a manner not previously experienced.
Infographics can be a way for students to express their or others’ data.
The basic and key material of an information graphic is
· the data
· information, or knowledge that the graphic presents with limited resources.
There are many types of Infographics- Statistical Based, TimeLine Based, Process based and Location or Geography Based.
More useful information on infographics:
Kathy Schrock- great explanation and large number of practical resources
Infographic a day for teachers- The always inventive David Warlick’s site presents useful infographics for teachers.
Good Infographics – a collaborative site which focuses on providing good quality web resources.
Infographic World
 RSS Feed